Data Representation and Processing 05 ( Spreadsheets / MS Excel )
Learning to work with spreadsheets
स्प्रेडशीट के साथ काम करना सीखना
To Read Class 6 Spreadsheets – Data Representation and Processing 01 -CLICK HERE
Spreadsheet : Spreadsheet is a computer application which helps us to store data. Examples of Spreadsheets are – MS Excel , Google Sheet , Libra Office Calc etc.
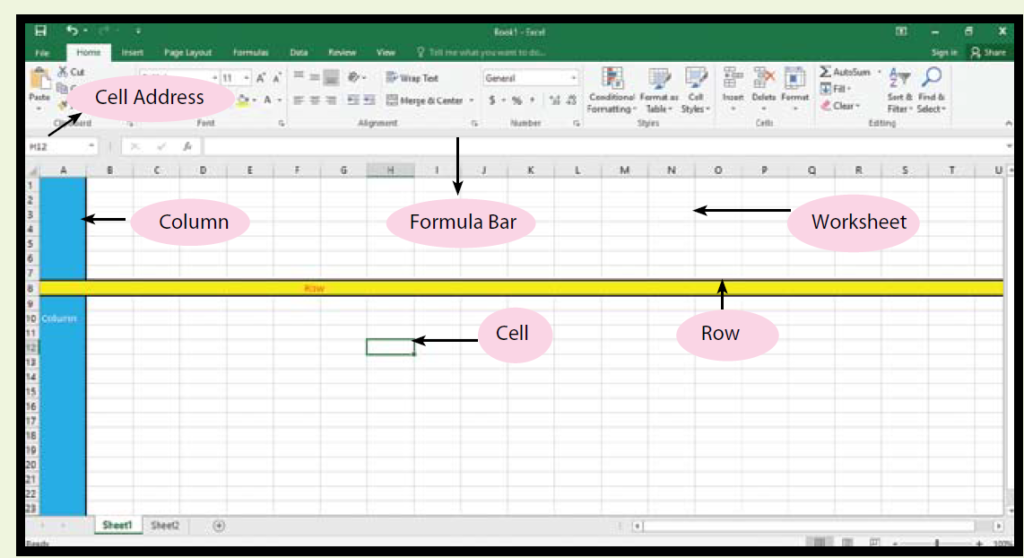
Parts of Spreadsheet
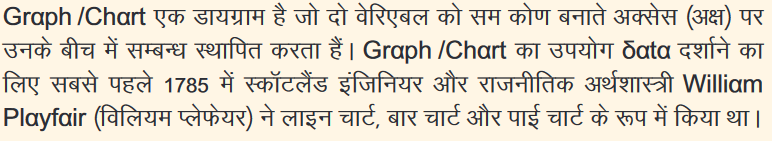
Graph / Chart
Graph / Chart –
Types of Chart
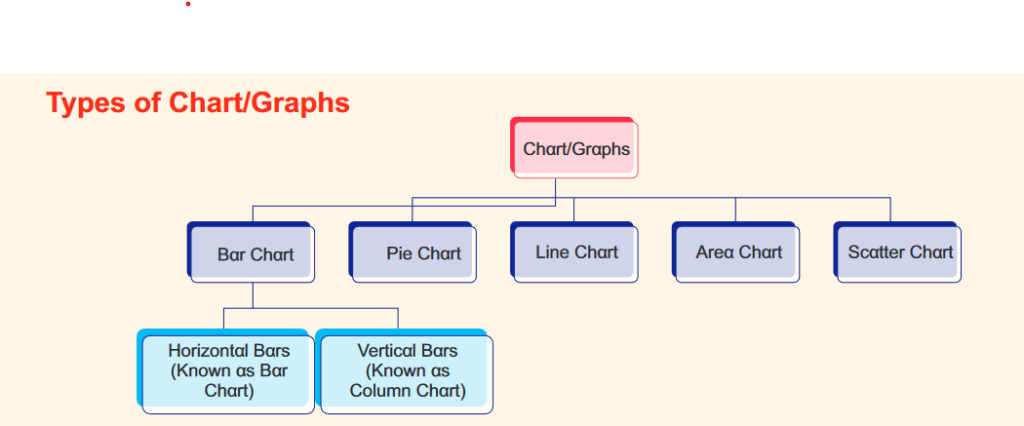
Charts / graphs are of many types –
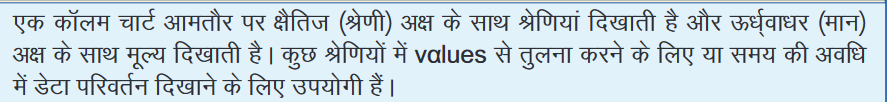
1.Column Chart
2. Line Chart

3. Pie Chart

4, Bar chart

5. Area Chart

6. Scatter Chart

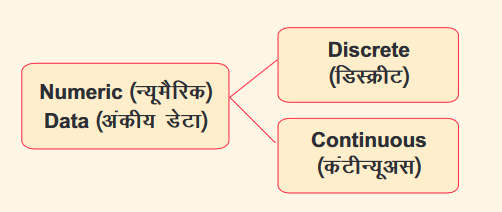
Numeric Data
Numeric Data – Numeric Data is data in form of numbers. Example Age , Weight etc.
Types of Numeric Data
Numeric Data is mainly of two types –
- Discrete Data
- Continuous Data
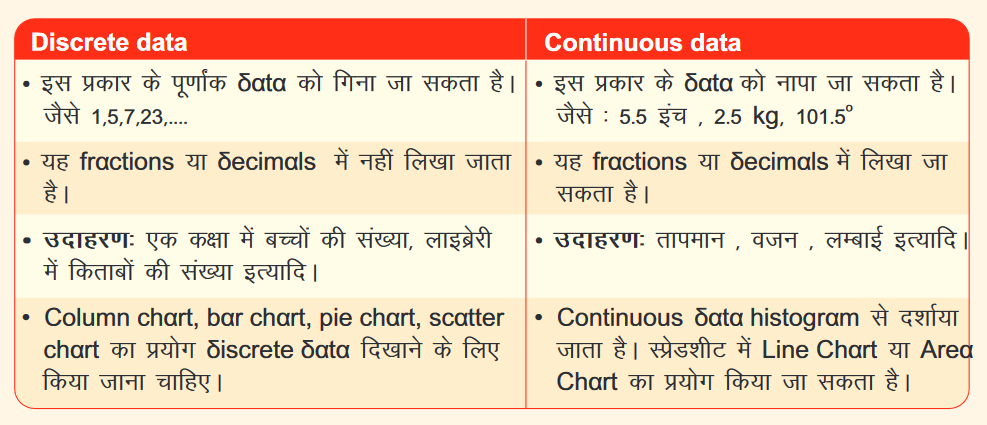
Difference Between Discrete Data and continuous data
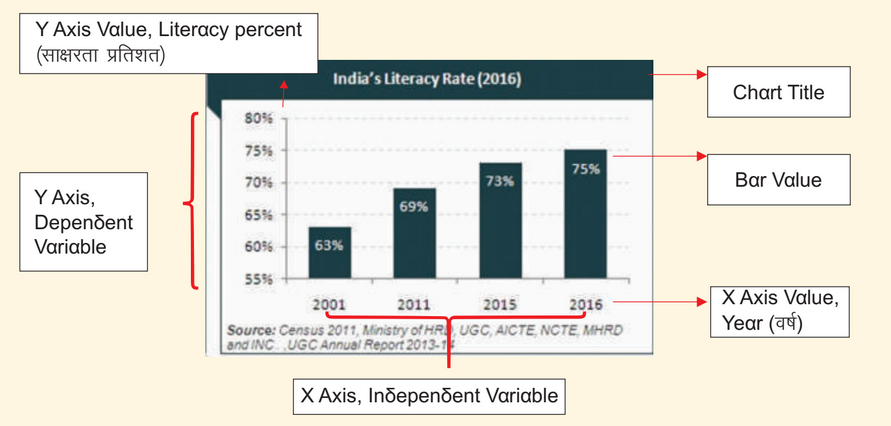
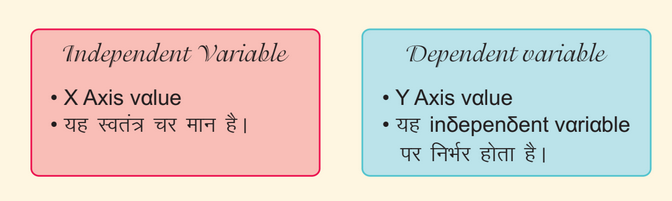
Components of a Graph / Chart
Analysing Data through Graphs

Inserting Chart / graph in a spreadsheet
Below are the steps to insert chart / graph in a spreadsheet –
Step 1 – create a table of data in spreadsheet.
Step 2 – select the table.
step 3 – Now Click on Insert tab.
Step 4 – Now select the type of chart you want to insert. For example- click on column chart.
Step 5 – Now select design of column chart and chart will be inserted in spreadsheet.
Editing a chart Area in Spreadsheet
Step 1 – To change Heading , double click on heading and write the heading you want.
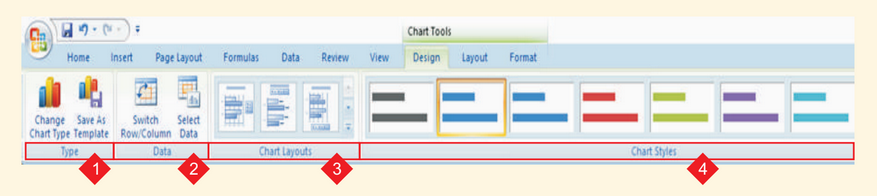


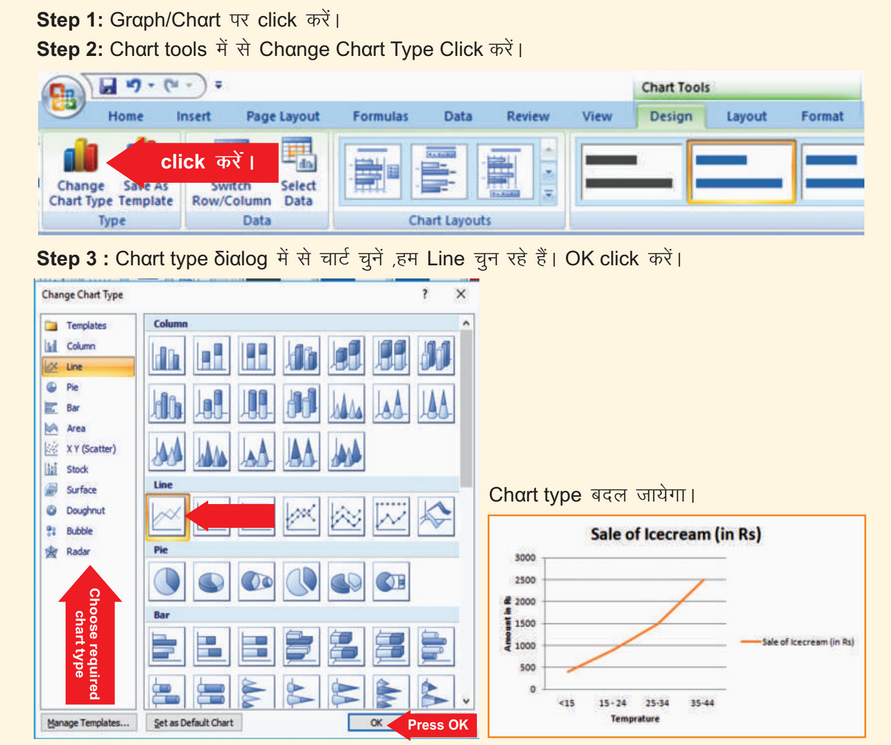
Editing Chart Type
Data Analysis using Sort , Filters ,Subtotal , Advanced Formula etc
Sort Option – It is used to arrange data in ascending or descending order.
Filter Option – It is used to limit data. It can help in emphasizing on specific data.
Subtotal – Total of all values is known as Grand Total, But total of a category values is known as subtotal. Total of all subtotal is known as Grand total. It is used to total of various category values.
Formula – Formula in spreadheet is started using “=” sign. Formula can be copied using Fill handle. In formula bar we can also use various functions inbuilt in spreadheet.
Draw information by analyzing data and represent it using graphs-

Pivot Table–

To use Pivot table following steps are needed-
- Select data
- Insert a Pivot Table
- Drag fields
- Add Pivot Chart
- Change Summary Calculation
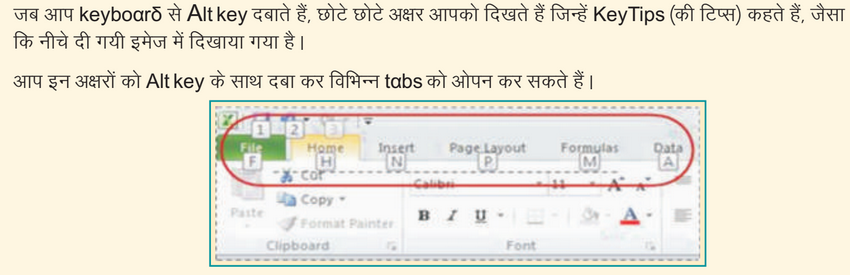
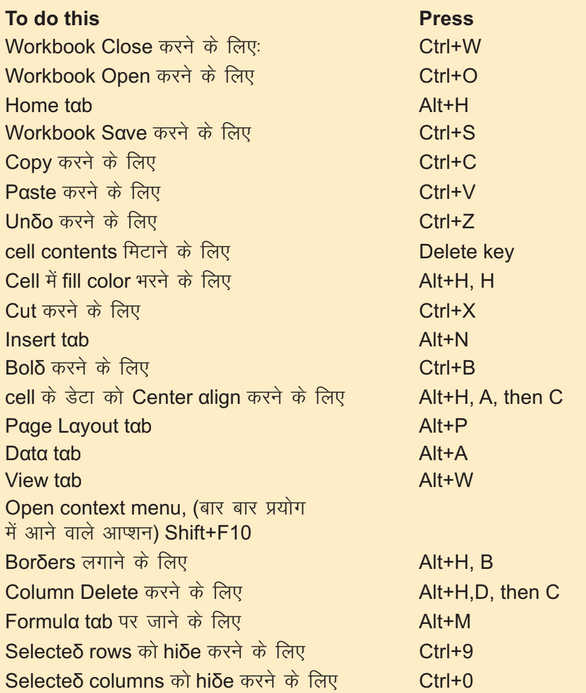
Ribbon keyboard shortcuts
Frequently used shortcuts
For Exercise of Chapter 1 Class8 Click Here
If some one wishes to be updated with most up-to-date technologiestherefore he must be go to see this web page and be up to dateall the time.
Class 8 chapter 1 data reproduction and process for spaceship